3.3 Surface Slope
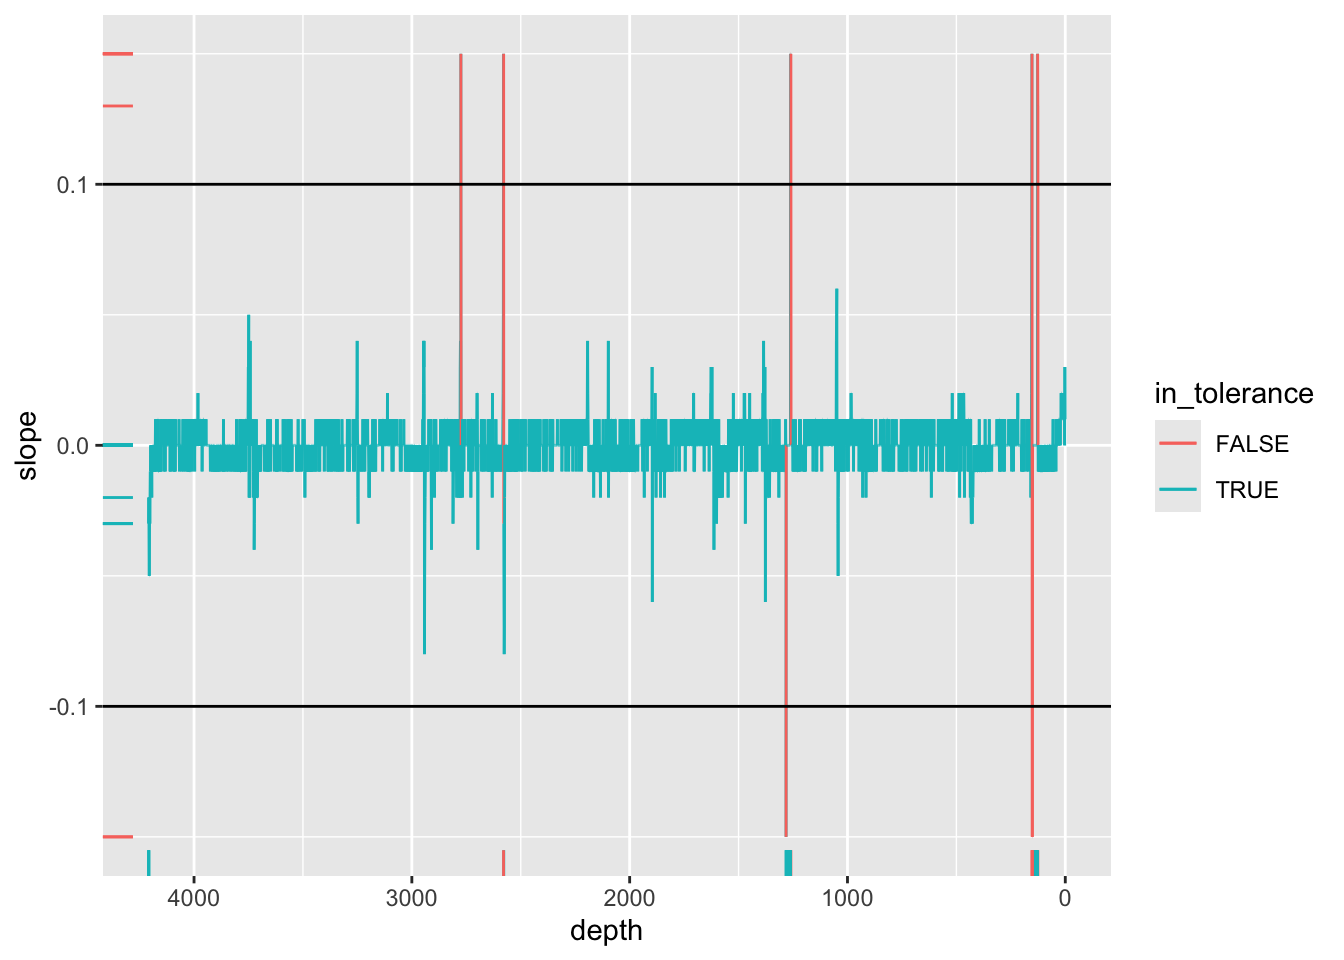
There is a relationship between the slope of the surface of the core material and the intensity for most elements. Hence areas with a large slope may produce an increase or decrease in a particular element intensity regardless of any actual change in the abundance of an element. This can be corrected for where the effect can be quantified experimentally, but Jarvis, Croudace, and Rothwell (2015) report results of experiments where the slope varies from -0.3 to +0.3 causing variation of around 120 to 80% of the true value. As such, we might initially seek to exclude areas of the core with a high slope. By default, itraxR::itrax_import() doesn’t import the sample surface variable, so the parameter parameters = "all" should be passed to access it. The computation is simple to perform using dplyr::lag(), and could be used as part of a conditional expression that would mark all measurements with a slope beyond a certain tolerance as having validity == FALSE. For example, the example below marks all values with a slope (in either direction) greater than 0.1 mm/200 μm (1:5) as being invalid. As shown for the core below, the core slope is well within the defined tolerances.
CD166_19_xrf %>%
  mutate(slope = `sample surface` - dplyr::lag(`sample surface`)) %>%
  mutate(in_tolerance = ifelse(slope <=-0.1 | slope >=0.1 | is.na(slope) == TRUE, FALSE, TRUE)) %>%

  ggplot(mapping = aes(x = depth, y = slope, col = in_tolerance)) +
  scale_y_continuous(limits = c(-0.15, 0.15), oob = scales::squish) +
  geom_line(aes(group = 1)) +
  geom_hline(yintercept = c(-0.1, 0.1)) +
  geom_rug(data = . %>% filter(validity == FALSE)) +
  scale_x_reverse()