4.3 Combining Images with XRF Data
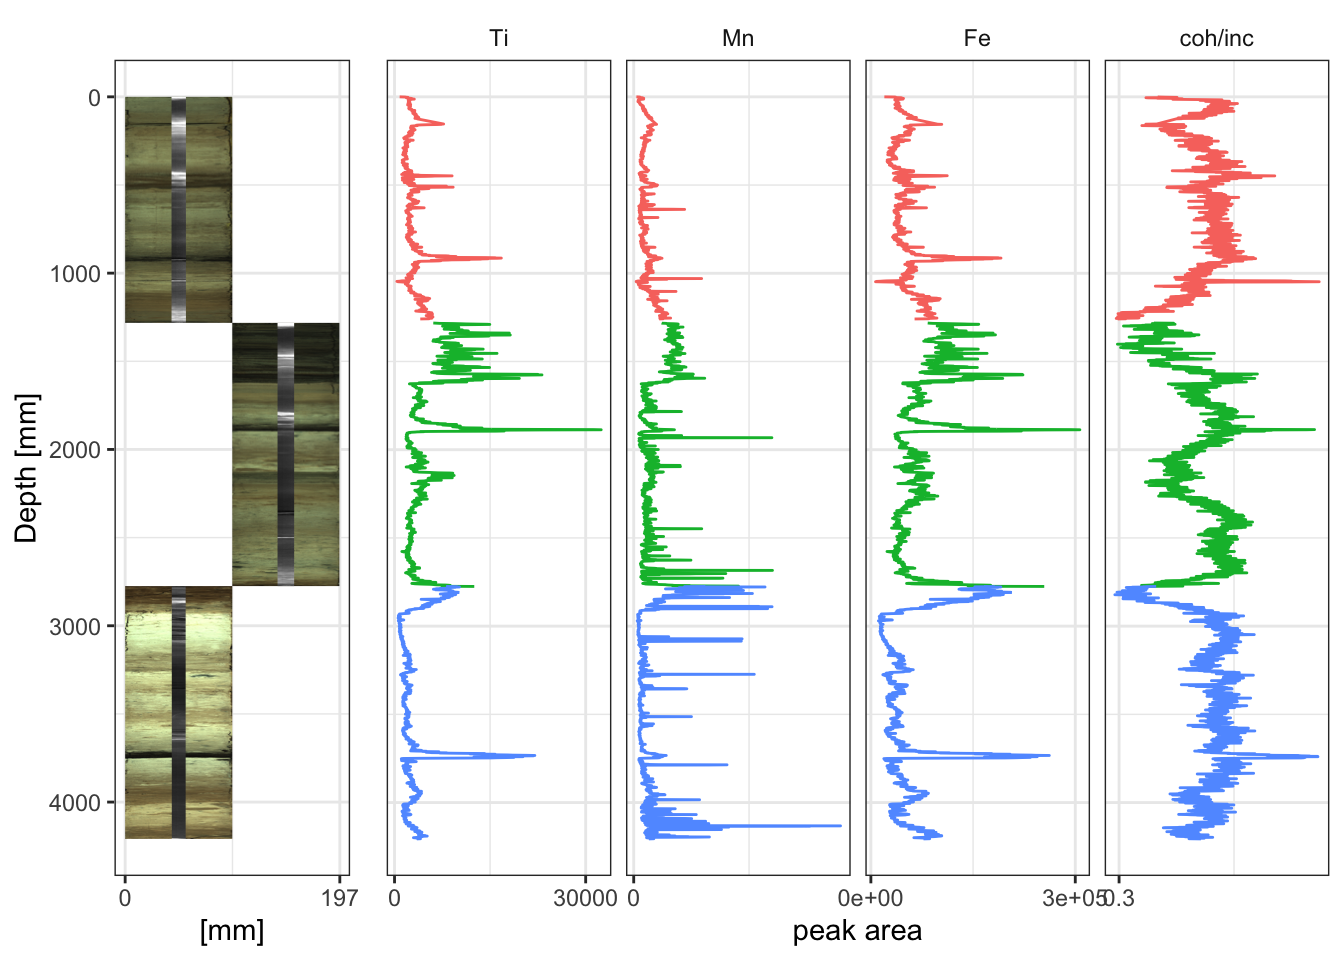
It is possible to combine different plots. For example, it is often desirable to plot the XRF data alongside the core imagery. By not passing coord_fixed(ratio = 1) to the image plot, its relative width can be controlled via widths =, which makes for a visually pleasing plot. Note also that the y-axis labels have been removed from all but one of the plots to avoid duplication.
egg::ggarrange(imagePlot + theme_paleo(),
               xrfStrat + theme(axis.title.y = element_blank(),
                                axis.text.y  = element_blank(),
                                axis.ticks.y = element_blank()),
               ncol = 2,
               widths = c(1, 4) # these are relative. For c(1, 5), the first plot will be 1/5th the width of the second.
               )