3.4 High Argon
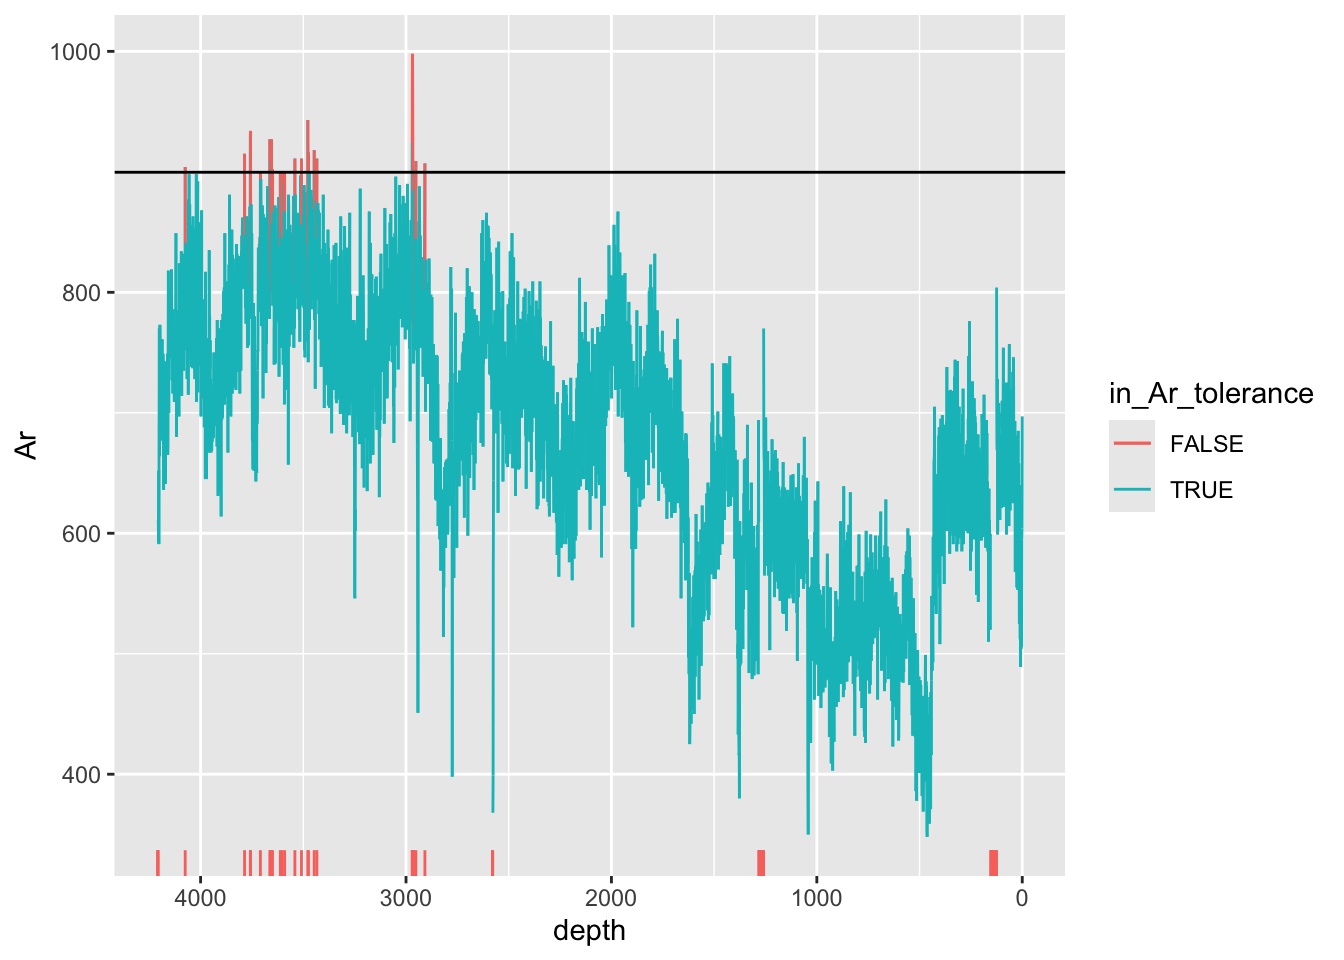
Argon is present in the atmosphere at concentrations of around 1% volume, and therefore is present in our spectra because the instrument operates in air. The amount of Ar that is measured is dependent on the length of the optical path, which should remain relatively constant, and any air present in the sample area. This can vary depending on cracks and voids, and thus high Ar is often an indicator of a potentially problematic measurement. This method differs from the others because it uses the standard deviation to compute the limits - this is because every scan configuration and material will be different. You will need to tune these limits to suit your data.
CD166_19_xrf %>%
  mutate(in_Ar_tolerance = ifelse(Ar >=mean(Ar, na.rm = TRUE) + 2*sd(Ar, na.rm = TRUE) | is.na(Ar), FALSE, TRUE)) %>%

  ggplot(mapping = aes(x = depth,  y = Ar, col = in_Ar_tolerance)) +
  geom_line(aes(group = 1)) +
  scale_x_reverse() +
  geom_hline(yintercept = mean(CD166_19_xrf$Ar, na.rm = TRUE) + 2*sd(CD166_19_xrf$Ar, na.rm = TRUE)) +
  geom_rug(sides = "b", data = . %>% filter(in_Ar_tolerance == FALSE))
## Warning: Removed 3 rows containing missing values or values outside the scale range
## (`geom_line()`).